“ ”

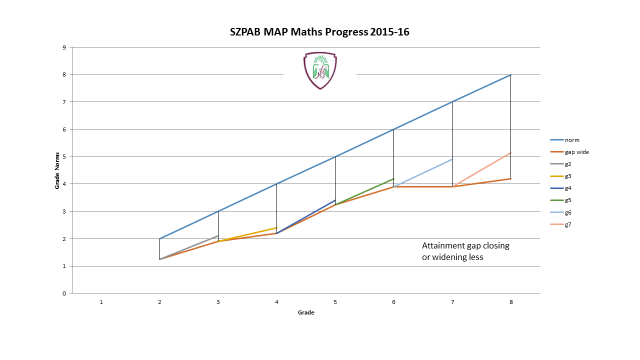
Figure 1: MAP Maths progress graph

The creation of benchmarks using MAP
In order to create a standardised, reliable and comparable attainment benchmark, the school entered all students from Grade 2 and above for Measuring Academic Progress (MAP) tests as early as possible in Term 1. Even by then, our teachers had been reporting low attainment across the subject range and across grade levels. Their judgements were based on internal assessments and observations at that time.
Our MAP scores in Term 1 indicated that students in Grade 7 were, on average, four grade levels behind their average global counterparts. Tracking back from Grade 7 to Grade 2, we saw that students had, roughly, fallen back an average of half a grade level in attainment per academic year prior to joining the school. This proved to be the case in both reading and mathematics.
The Term 1 MAP scores corroborated teacher judgements about the students. As a new school, the data presented an opportunity for us to address the widening attainment gap and, potentially, demonstrate progress for students going forward. In other respects, the very low attainment was alarming in terms of the drastic revision that would be required for the school to effectively deliver its curriculum to a cohort of students with such weak foundations in required knowledge and skills.
MAP tests were repeated each term to track progress over the year. The Term 3 MAP results showed that we had, at worst, stopped the gap getting wider in both reading and mathematics, and closed the gap significantly in some grades (see figure 1).
Ability versus attainment
The work with our students in that first year had certainly produced measurable improvement but our Grade 7 students were still, on average, three Grade levels behind the average MAP tested student.
During that first year of the school’s journey, many teachers used an expression about students’ ability that ‘jarred’ with me. An expression that I never heard used in UK schools, where I had spent all of my career, until moving to Abu Dhabi. They labelled students as ‘low’, in reference to their ability.
But questions had emerged:
- Was the far less than average attainment in MAP due to far less than average ability?
- Was the low performance in MAP a function of students’ inability to interpret the language of the questions?
- Or a little of both?
We needed an ability test for these students, something that would give a credible answer to these questions.
I had used CAT4 tests in London to benchmark students at my previous school, La Retraite RC Girl’s School. The data from the CAT4 tests suggested that most students would be unlikely to progress to A level courses, never mind higher education. The fact that so many subsequently went on to university showed that we had demonstrably improved their life chances.
“ ”


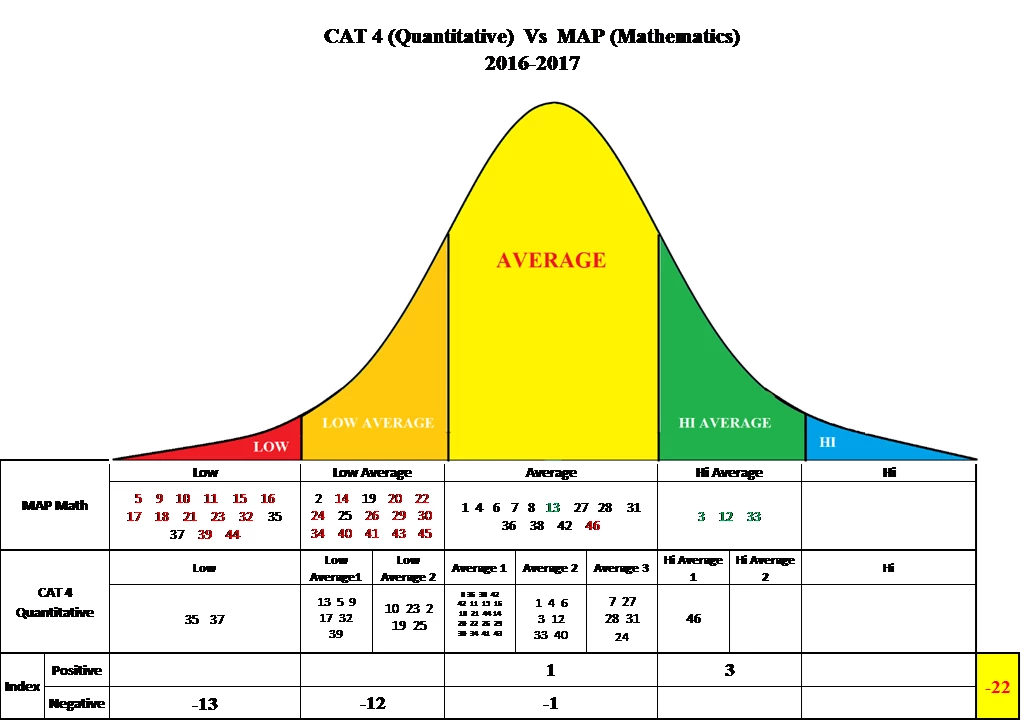
Figure 2

Matching CAT4 with MAP
MAP data uses the scores students achieve to place students in five categories of attainment, while CAT4 uses the test data to place students in five ability groupings, with some sub-divisions. These five MAP and CAT4 divisions were overlaid to produce a meaningful insight into students’ attainment in MAP versus their cognitive ability.
By assigning a refence number to each student, we were able to place the cohort in ‘divisions’ for both MAP and CAT4. This would, we conjectured, immediately provide the opportunity to note which students had either over-achieved, under-achieved or achieved in-line with MAP, when referenced against their individual CAT4 score.
The first comparison we made was between MAP Mathematics and CAT4 Quantitative (Figure 2). This first chart implies significant under-achievement in MAP Mathematics.
We counted the number of students that were a division lower in MAP than CAT4 (red numbers) or higher in MAP than CAT4 (green numbers) and then calculated the overall score to create indices for each chart (these could be expressed either as raw numbers or as percentages of a test cohort).
Our Performance Progress Index number for comparing MAP (Mathematics) and CAT4 (Numeracy) was -22. At first glance this looked terrible! Did it mean we were failing our students and, if so, how? Our MAP progress data from Term 1 to Term 3 was very strong. This informed us that our new students must have been performing far below their cognitive ability in the years prior to joining our school.
Using the MAP and CAT Performance Progress Index to identify the problem
We had suspected that the levels of literacy required to successfully complete MAP tests were an obstacle to our students’ success with MAP.
MAP questions require a certain level of literacy in order to understand and complete the questions correctly.
When a student is faced with this literacy challenge for 50 consecutive questions during a MAP test, it is legitimate to wonder whether the resilience and attention of the student will be more than usually challenged and contribute to even lower performance and test scores.
To help us support this hypothesis we compared MAP Mathematics and the CAT4 Verbal battery.
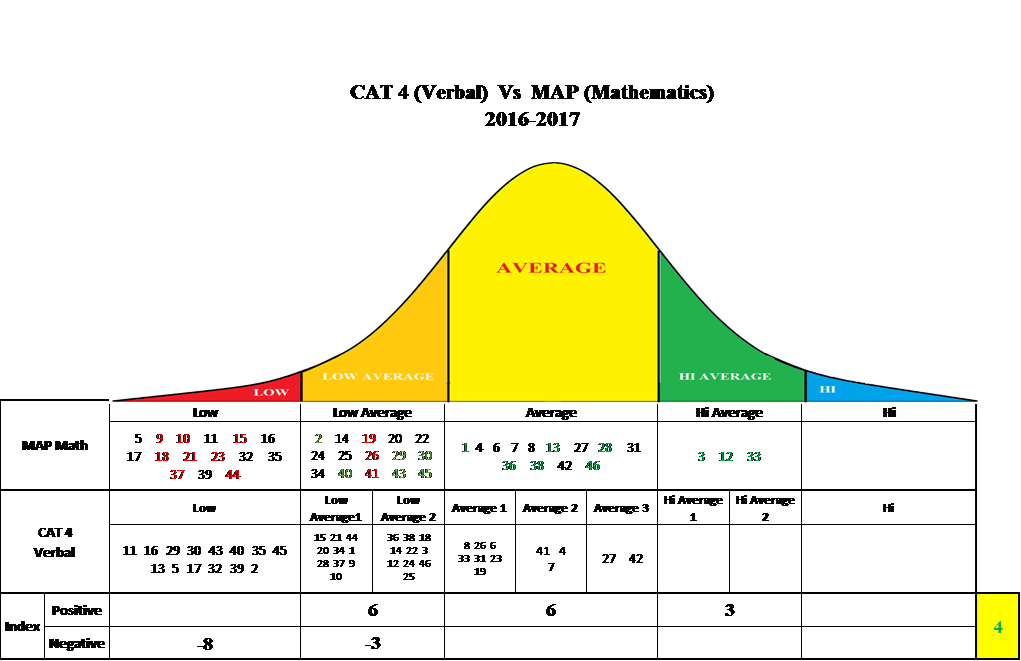
Figure 3 shows that students’ MAP Mathematics scores are in line with CAT4 Verbal scores. The Performance Progress Index for this data comparison is +4.
Our conclusion from the charts (Figures 2 and 3) is, therefore, that students’ literacy levels are a clear and significant obstacle to their achievement in mathematics. The subsequent action from such evidence takes place in the classroom, and such easily understood and triangulated data is unquantifiably effective in helping teachers really grasp the concept of using data to inform their practice.
AT SZPAB, mathematics teachers are now completely clear that developing subject literacy is a key factor in enhancing students’ success in their subject.


Figure 3

Using the MAP and CAT4 Performance Progress Index to inform individual interventions
Following a similar comparison between MAP (Reading) and CAT4 (Verbal), the Performance Progress Index was 0, indicating that overall progress is in line with ability. However, the chart identifies those students that have exceeded (green) or fallen below (red) cognitive expectations. This provides the evidence teachers need to target their classroom interventions to support those that are under-achieving
Putting the data to work
Armed with this new insight into our students, the school has implemented three key initiatives:
- Use of data
- Language for learning
- Ownership of learning
Teachers are now given progress targets based on this cross-analysis of MAP and CAT4, and the overwhelming importance of literacy is now understood across the school.
The school holds fortnightly line management meetings, where a predetermined agenda includes literacy for learning questioning. This addresses subject matter terminology and key questioning terms that students will need to understand. This has been supported with a high volume of class observations where language is always a focus.
The school has also shared data with the students. They know what level they are, where they should get to this year and what resources and support they can call on. Stickers in the classroom announce what students expect to learn this week, and at the start of each lesson they are encouraged to state what they want to achieve.


Using the Performance Progress Indices as comparative progress measures
Our original goal at SZPAB was to find a data-driven method to explain below average achievement for our students and to investigate any link between literacy levels and performance in mathematics MAP tests. Consequently, we have been able to plan whole-school improvement strategies, as well as individual student interventions to achieve higher student attainment.
As a by-product of our investigation, we have inadvertently provided ourselves with a Performance Progress Index for judging MAP scores against CAT4 that could very well be used to compare performance within grade levels, across grade levels or across schools.
The beauty of our Performance Progress Index is that it does not discriminate against a school’s ability intake. In other words, student progress in a school with an average ability intake can be directly compared with students’ progress in a school with a high ability or lower ability intake.
And finally …
Further interrogation of our data will follow and we intend to refine our Performance Progress Index, both to measure progress and identify individual interventions.
The methodology is a little untidy, refinements are needed and we have made some assumptions, but the benefits of the linkage between attainment and cognitive ability provided by MAP and CAT4 data tools, are already being seen at Sheikh Zayed Private Academy for Boys.

