Effective analysis of data in an IB curriculum school
Beijing City International School
Beijing City International School (BCIS) is a not-for-profit private school with over 1,000 students from more than 31 nationalities. Enrolling Chinese national students alongside students from around the world, the school delivers an academic programme from Toddler to Grade 12. An International Baccalaureate World School, BCIS teach the Primary Years Programme (PYP), Middle Years Programme (MYP) and Diploma Programme (DP), also incorporating the Chinese national curriculum into their teaching.
In 2016, the school initiated a five-year programme of student assessment to inform and improve teaching and learning in the school.
Tanya Farrol, Middle School Learning Support teacher, explains:
“The collection of student data had historically been inconsistent due to school leadership changes. The new leadership team wanted to set in place a structured and consistent programme that would address both learning and wellbeing needs, and provide the school with data on trends over time.”
Key outcomes
-
A well-planned and structured introduction programme will accelerate teacher engagement and understanding of the data
-
Sharing data with learning and wellbeing support teams, as well as teaching staff, helps ensure that every student’s support needs are identified
Objectives and the assessment cycle
The BCIS senior team wanted an assessment regime that would help them to identify individual students’ strengths and areas for improvement, track progress, inform teaching and learning, and focus instructional practices.
They also wanted to be able to determine professional development and resourcing requirements, inform curriculum development and ensure it was addressing students’ learning needs plus provide holistic information on academic and social development.
Tanya explains: “The reason we chose the GL Education’s Cognitive Abilities Test (CAT4), Pupil Attitudes to Self and School (PASS) survey, Progress Test in Maths (PTM) and New Group Reading Test (NGRT) was because they gave us student information that is attitudinal (PASS), based on attainment (PTM, NGRT) and focuses on academic potential (CAT4). They provide a holistic picture of each student, and the individual assessments are designed to work effectively together.”
During the course of the first term in the academic year, students from Grades 6–10 sit the assessments – NGRT in August, PTM in September, CAT4 in October and PASS in November. The reports are available immediately after each round of testing so that teachers can carry out their own analysis. The Learning Support Team carry out a triangulation exercise in January and produce consolidated data and trends reports for each student.
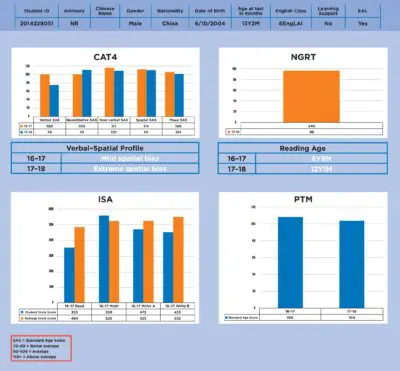
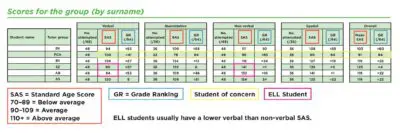
Example of an individual student overview
How the data is reviewed
The data is reviewed and acted on by key departments around the school.
The Faculty and Student Support Team (FSST) evaluate the data and locate trends or interventions as needed. Team leaders review the data and share it with their teams. Learning Support works with each department to help them implement interventions for specific students. The English Language Learners (ELL) Team uses the data to support English language placement decisions. The counsellor reviews the PASS data to support teachers in identifying students who may need support and interventions.
Tanya explains: “With our support teams and leadership all looking at the data, we’re confident that the needs of our students are being identified as never before. But we really see the difference in how our teachers approach their students, especially as a result of the PASS data. Teachers are asking much earlier for differentiated support.”
The introduction of the assessment programme was led by the Learning Support Team. As Tanya explains, “It was a logical choice because the Learning Support Team are used to working with Special Educational Needs (SEN) data and referrals processes, as well as working across all age groups in the school.”

Putting interventions in place
It’s too early in the school’s journey to properly measure the impact on student outcomes, but student needs identified by the data are already driving a range of initiatives and interventions, including:
- Literacy interventions
A Drop Everything and Read (DEAR) programme has been introduced for Grades 6–8. Students spend 40 minutes each week with their own choice of books, designed to encourage enjoyment in reading. In English Language Acquisition classes, Grade 6 teachers have grouped students based on their NGRT results for weekly focus lessons on specific literacy needs – comprehension, grammar or vocabulary.
- Numeracy interventions
By evaluating PTM scores alongside their performance in class, specific students were identified to take part in additional maths workshops to address gaps in their understanding.
- Monitoring progress
The Learning Support Team compares CAT4 data with attainment data to identify students who are not making the progress that might be expected. Tanya explains how this data can reveal students whose support needs have not been identified through classroom observation: “Recently, by triangulating CAT4 scores with other data, I identified an underperforming student who needed additional support with his reading and writing. His teachers just thought that he didn’t care about the quality of his work, that everything was the bare minimum and rushed. But I could see from his CAT4 scores that he had the potential to do much better than the grades he was getting. To ascertain his exact issues with reading and writing, I delved deeper with additional assessments to determine exactly which areas required support. He now has a targeted plan to improve his spelling, sentence structure and writing fluency.”
- Wellbeing
Cohort-level data from the PASS survey has been used to strengthen the school’s advisory programme. The counsellor used the PASS data to identify individual students at risk of disengagement and flagged them for advisors to engage and strengthen relationships with the students. Students in Grades 11 and 12 were not tested, but teachers from these grades were asked to comment on the Grade 10 students’ data to identify support that students may need to effectively transition into the DP programme.

A structured programme to introduce the assessments
The school implemented the following steps to introduce the new assessments:
1. The Learning Support Team spoke with individual subject teams to introduce the first assessments to be used – NGRT and PTM.
2. Following the initial testing with NGRT, subject team leaders were coached in how to read the reports and identify ways that reading instruction could be supported in their areas.
3. Once all the assessments had been administered, hard copy reports were printed and drop-in sessions were held over a two-day period for individual teachers.
4. In January, structured training sessions were held for teachers in each grade level. Overviews of the individual assessments were followed by hands-on data analysis where teachers were encouraged to identify trends in their classes or specific interventions for individual students.
5. A follow-up survey of teachers collected data on which interventions teachers were using and which interventions they would like more information about. The Student Support Team is now building a resource bank of interventions that target priority learning needs identified from this data. This information will help accelerate the effectiveness of the data the school now has, and will act as an aid for new teachers joining the school in future.

Example reports, using real student data, were used to explain key concepts and promote discussion about the data.
Next steps
The school will continue to build on the existing support it provides for teachers, both in extending the bank of interventions and in increasing collaboration between subject teachers and specialists. The school has realised that they need to give teachers dedicated time to analyse and decide how to use the data in their classes.
Curriculum coordinators are analysing the data to inform future curriculum developments to address the learning needs of the school’s student population, and school administrators are planning to use data trends to determine professional development needs and predict staffing requirements.
“Teaching in the IB is all about knowing and understanding students,” says Tanya, “and this data just helps that process.”