“ ”
Using data to provide personalised learning journeys
The school began to use GL Education’s Cognitive Abilities Test (CAT4), Progress Test Series (PT Series) and New Group Reading Test (NGRT), alongside their internal system of age-related curriculum expectations (or steps) for each subject.
This provided teachers with a comprehensive overview of each student and allowed individualised learning journeys to be mapped for each child. Tassos explains: “Once the curriculum expectations were clear, the next step was to identify start points. The assessments from GL Education provide a range of information to support this. CAT4 helped us to identify cognitive ability, particularly for those perceived as having either lower or greater ability. It also validated what we knew – that literacy was a real issue, with the CAT4 verbal battery results generally being lower than non-verbal, spatial and quantitative reasoning. We also used NGRT to validate this.”
Student data sheets
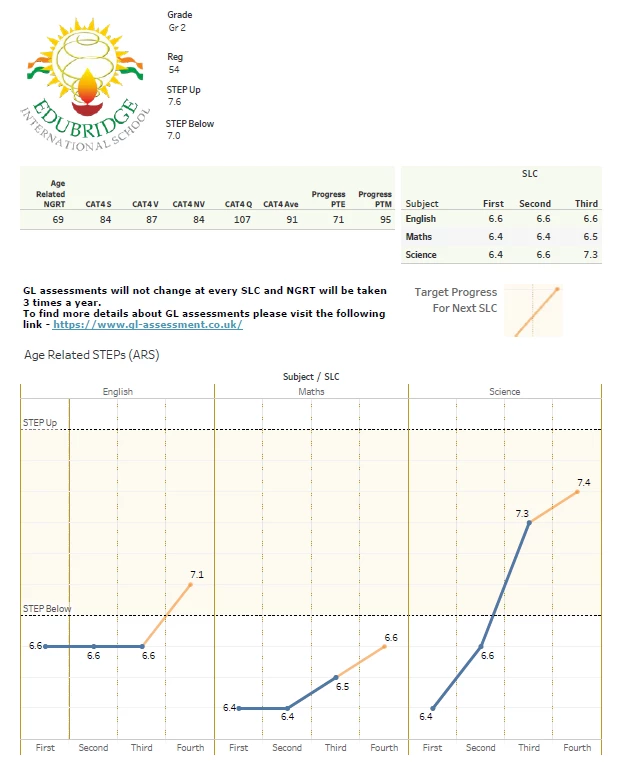
Edubridge developed progress sheets that summarised each student’s CAT4, PT Series and NGRT results alongside where they were on the age-related curriculum steps. These were reviewed every six weeks, allowing at-a-glance snapshots of student progress throughout the school year.
The new system supported teachers, students and parents in having informed conversations around where each student had got to on their learning journey. They were able to discuss and identify areas for improvement and pinpoint where additional support or challenge might be needed.
“I don’t think that I’ve had a single difficult conversation with a parent since I’ve had this data” Tassos explains. “I can quickly refer to the progress sheet and see current attainment compared with ability and age-related expectations for each individual student.
The sheets are an extremely effective source of background information for teachers. They already knew their students, but the data provided validation and evidence of this, allowing the identification of areas of weakness and incorporating this knowledge into their planning. The data is a starting point which can lead into further questioning and exploration.”

The student progress sheet brings together scores from CAT4, NGRT and the school’s internal assessment to provide a complete picture of each student.
“ ”
Encouraging learner agency
The data also promoted learner agency – building the critical thinking and problem-solving skills that students need across the curriculum. The information empowered students to talk about their learning and helped identify where they are in terms of attainment, allowing them to manage their own progress.
Tassos explains: “Students collect evidence in digital portfolios, where we can track progress through their work and conversations. Every six weeks we’ll have a student-led conference (SLC) where we review where each student is in terms of progress, and in terms of evidence of learning.
We divide the year into six and expect a 1/6th of movement between each. We are able to triangulate the evidence to empower students to own their learning, developing strategies and setting goals between each SLC to maximise progress. We use stanine 5 or a Standard Age Score (SAS) of 100 as the criteria for matching age-related expectations. This mapped very well with the evidence of learning and meant that we could deal with difficult conversations such as ‘if you feel that you should be on a step higher, then give me the evidence.’ This was also helpful when talking to parents as the data helped to set realistic expectations and to enlist them in providing the most appropriate support at home.”
Using data for literacy intervention
A large proportion of the students at Edubridge have English as an Additional Language (EAL), so the team were aware that literacy was an area that they wanted to look at specifically.
Students who were identified by CAT4 as having a lower verbal ability were further investigated using NGRT. Comparisons of different factors such as sentence completion, comprehension etc helped to differentiate between EAL students and those who may have other literacy support needs. These students were then investigated further using the York Assessment of Reading for Comprehension (YARC) to identify any specific problems and inform appropriate interventions.
Tassos explains: ‘The tests showed that whilst spoken skills were generally good, reading comprehension levels were low. The Literacy Co-ordinator was able to implement literacy plans, based on the results of NGRT and YARC, supporting early and effective intervention.
We ran after-school literacy groups that were directed by the test results, that have proven to be very effective. Suggested literacy strategies for teachers to use in their day-to-day teaching were also developed, including a Drop Everything and Read campaign, as well as Drop Everything and Write. We discovered that the impact of raising literacy could happen very quickly, as they’re all very aspirational students.’

Getting staff engaged
Having used GL Education’s assessments in a previous school, Tassos knew the impact that they could have.
“Implementation at Edubridge was very collaborative, involving the IT Manager, ICT Co-ordinator, learning support leader and subject leaders. The data was shared with teachers in an open and transparent way. We encouraged them to use the data putting together the information and applying this to students’ learning objectives. Staff could see where their class might not be doing as well as another, allowing opportunities for them to share knowledge and best practice in a blame-free culture.
The question level analysis also gave insight into areas of the curriculum where students had gaps in understanding, supporting lesson planning and personalisation of learning.
Fear can be the challenge when introducing new things, and there’s always a worry about generating data for data’s sake. But using the assessments from GL Education at Edubridge has given us quick results and enhanced learning conversations with parents, students and teachers.”


