Using data on cognitive ability, attainment and attitude to inform teaching and learning
Al Ittihad Private School - Jumeira
Al Ittihad Private School – Jumeira (IPS-J) is one of five Al Ittihad school branches in the UAE. The school is accredited by CIS and NEASC, delivering an American curriculum to a vibrant community of over 2,400 students from Pre-K to Grade 12. IPS-J focuses on student learning in a safe and secure environment, ensuring every student reaches their potential.
The school uses a combination of internal and external assessment data to support planning, teaching and learning at all levels. GL Education’s Cognitive Abilities Test (CAT4) is used to look at ability and potential, while Measuring Academic Progress (MAP) and internal assessment data is used to monitor students’ attainment and progress. GL Education’s Pupil Attitudes to Self and School (PASS) survey also provides insights into students’ attitudes to learning.
Lames Abdul Hadi is in charge of assessment across the Al Ittihad group. As Assessment Director she reviews which assessments the schools will use, as well as providing training for teachers and heads of department on using and understanding the data to feed back into the curriculum review cycle and benefit the school’s teaching and learning.
As part of her recent PhD, Lames has carried out what she believes to be the first academic work comparing MAP scores with CAT4 data and correlating these with the PISA-based Test for Schools. Her research found a good correlation, which gives her confidence that combining MAP and CAT4 data is an effective tool to use across the Al Ittihad school group.
Key outcomes
-
Combining cognitive ability, attainment and attitude data supports workload planning and class organisation
-
Data helps SLT with budgeting and decision-making across teaching, learning and pastoral needs
-
Data supports classroom teachers with lesson planning, differentiation and informing teaching strategies such as learning activities, grouping and seating plans
Using data to support planning and class organisation
At a senior level within IPS-J, data from CAT4, MAP and PASS is used to inform planning and class organisation. Grades within the school are not streamed, so the senior team wanted to ensure an even distribution of student ability, learning and behavioural support needs across the classes. By ‘shuffling’ classes between each academic year, they make sure that teacher workload across the cohort is evenly distributed.
Lames explains more: “As an American curriculum school, we do MAP three times per year for Grades 3 to 9 and twice for other grades. With CAT4, we test every grade by November.
In 2018, we took part in a pilot for KHDA (the Knowledge and Human Development Authority who are responsible for the growth and quality of private education in Dubai), using PASS with all grades from K to 12. Schools in Dubai carry out an annual student wellbeing census (DSWC), which provides them with an overview of wellbeing at a cohort level. We utilised the individual students’ PASS scores to understand these findings at a more granular level.”
She goes on: “Each year, using the MAP, CAT4 and PASS data, we are able to redistribute students across our classes. The reason we do this is because we have previously had issues with there being weaker classes and stronger classes, some behavioural issues concentrated in certain classes, parent pressure to keep children in with their friends and so on – so they weren’t evenly distributed groups.
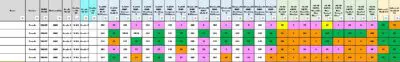
We created a spreadsheet that summarised the cohort’s MAP scores for Math, Science, Reading and Language and the CAT4 Standard Age Score (SAS) and stanine scores for each of the four batteries – plus the mean SAS. We also included a column with dropdown options for teachers and admin to add comments, including information on each student’s friends, to ensure they had at least two in their new class.”
After looking at the feedback from the team and the MAP and CAT4 data, we correlate in our PASS data to ensure that we don’t get a group in one class with certain attitudinal issues that are revealed by their PASS scores. This cumulative information allows us to shuffle the classes and redistribute them into evenly spread groups. We do this each year across the school and have recently expanded the process up to Grade 12.”
Using data to support decision-making and school evaluation
The school also uses data to assess the impact of their strategic plan.
Lames explains: “All our strategic targets are put in quantitative terminology. For example, when we target increasing student literacy we go back and look at the MAP and CAT4 stanines and see what extra support is needed.
We are currently putting in place the budget for next year so we are looking at an intervention plan, based on students who have lower CAT4 verbal scores and are in the lower MAP reading percentiles. We are also looking at numeracy interventions – so we look at the MAP math percentiles and students who are lower in CAT4 spatial. We use assessment data to confirm the accurate identification of gifted & talented students along with students with educational learning needs.
Whenever we have completed a cycle of assessment, we have a data meeting to discuss the outcomes and review progress.”
Using data to inform differentiation and ongoing teaching
At classroom teacher level, the data helps personalisation of teaching and learning. Teachers can quickly see each student’s areas of strength and any areas of concern, which informs lesson planning and more effective differentiation of activities to support different learning needs.
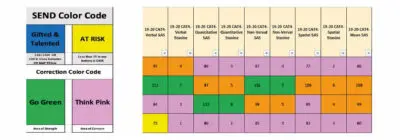
Lames explains the process: “At the beginning of the year we share ‘data heat map’ spreadsheets with each class teacher. These are simple excel dynamic files that are updated three times per year and summarise the students’ scores in MAP, CAT4 and our internal assessments. They are colour-coded for ease of interpretation and include previous year’s data and teacher feedback, which helps the new class teacher get a quick and clear view of their incoming students’ ability, attainment and attitude. Every cycle we update the file, creating an ongoing tracking system for every student.
By looking at the data, teachers can see, for example, which students are gifted & talented, based on their CAT4 or MAP scores, and which have a verbal deficit (where there is a significant difference between the student’s CAT4 verbal and non-verbal scores, which can be an indication of students at risk of underachieving due to low English language ability). SEN students are also flagged.
We hold a workshop at the start of each year to give the teachers training on what the data means and how it can be used to support teaching and learning. The sheets are shared electronically, but also printed out at A3 size for those teachers who prefer to review the data that way. The reverse shows a simple key to the colour coding, as we know that some teachers are less comfortable with the data and this helps them to make the most of it.”
The team then uses the data heat maps to inform their ongoing teaching, lesson planning and the differentiation of learning activities. The school focuses on the individual CAT4 batteries at this point, so that they can see which students have ability and strengths in different subjects. The data also supports strategies such as pairing to improve learning.
Lames explains: “Based on the subject that’s being taught, and the topic, the data can inform which students are partnered for an activity. If you’re doing a project on, say, problem solving, you need students with strong logic, who have strong verbal reasoning (ie they can read and comprehend well) so that they can access the information within the verbal problem. It’s not just about the math ability, if they can’t read and comprehend, then they won’t be able to access the task.
We start with a seating plan related to the activity and define our lesson plan and our observation tool to include details of what data to use. This helps getting feedback and also training teachers.
One student, for example, was struggling in math – so I reviewed their data with the teacher and saw that they had a low spatial score, but good quantitative and non-verbal, which indicated that they might be strong in algebra but could struggle with bigger concepts and interpreting graphs. We paired them with a student who had strong spatial ability and is good at thinking aloud and discussing, so the struggling student benefited from the scaffolding that their partner could bring. After a month, we saw a great improvement.”

The student progress sheet brings together scores from CAT4, NGRT and the school’s internal assessment to provide a complete picture of each student.
Sharing the data with other stakeholders
The data also supports the school when they are guiding the students in their elective subjects.
Lames explains: “We have encouraged our counsellor this year to look at the data before they have conversations with Grade 8 students who are choosing their career path and electives. They can look at the same data heat map as the teachers, so they see not only internal assessment and MAP, but look at the CAT4 batteries to see for example, who might be strong in STEM and who might then want to go into, say, engineering. Or if the student wants to go into STEM subjects, but need to work on their spatial skills, the counsellor could encourage them to work on their imagination, graphic design or drawing skills. The data will support the counsellor in guiding the students.
The CAT4 reports are also shared with the Humanities, Art and ICT teams. Lames explains: “We translate some information from the CAT4 reports into Arabic so that we can share and train Arabic teachers too. For example, in the Group report for teachers, the narrative section that summarises which students fall into each broad profile (such as those with an extreme verbal bias or a mild spatial bias) is translated, to help in grouping students.”

Explaining the different types of ability to students
The school also shares the CAT4 Individual reports with students and their parents each year.
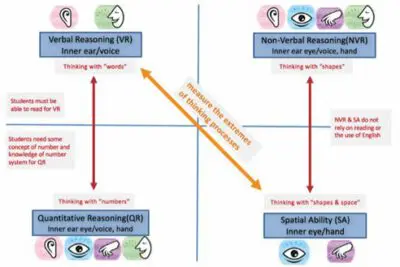
Lames explains: “Our conversations with students and parents are supported by the CAT4 reports which provide students with tips and advice about their abilities.
I also created this diagram to support them in understanding the different CAT4 batteries and what each means.”
Sharing best practice and supporting inspections
The school continues to support the implementation of the data with training, bringing in best practice from other teachers, doing peer observations and celebrating success stories. Lames explains: “We keep showing how the data has been used to solve student issues and improve student progress. The data will also support teachers during inspections, where they will be expected to show what assessment information they have used to create their lesson plan. Teachers are encouraged to keep a planning portfolio with the lesson plan, seating plan and assessment information (in the data heat map) – so everything is in one place.”
Data also helps when teachers need to discuss any child in the class with the senior team, as all of the information is easily accessible on one sheet, colour-coded. “Sometimes a teacher might call me to be involved in a parent meeting,” Lames explains, “and I am not as familiar with the child as they are. But I can look on the data heat map and see where that child is and be able to discuss their attainment and progress, or any wellbeing issues.”

The impact
IPS-J has used this system for three years and has seen a big impact.
Lames explains: “Our previous MAP results often had one class high, another low, now we have very consistent outcomes, which validates that classes are fair. And through the class environment we can see that it’s going well – we never feel that any teacher is struggling. Teachers don’t feel they have a weaker class, and all believe the distribution of students is fair. They are also able to differentiate their teaching better, with a better understanding of the strengths and weaknesses of the class.”
Data is supporting the school in delivering the objectives that they have set. The insights into student performance gained from combining ability and attainment data have allowed IPS-J to plan effectively, ensure teacher workload is evenly distributed and teaching has maximum impact.