Multi-school dashboards
Join the dots to get a full picture of your students’ results
Developed together with colleagues across school groups, our new multi-school dashboards allow strategic leaders to easily and efficiently access headline data and comparative analysis – to better inform decision-making. Compare data from CAT4, the Progress Test Series and the New Group Reading Test (NGRT) to quickly identify trends or correlations and further understand the picture across schools: identify areas of strength and concern, and drive targeted interventions.
How the multi-school dashboard can help you
Group-wide visibility
Group leaders access a unified view of headline data across assessments – to identify strengths and weaknesses across the group and within key student demographics.
- Organisation-wide reporting across CAT4, NGRT, NGST, NGMT, PTM, PTE and PTS.
- Filter your schools according to your needs: view aggregated results across all settings or focus on priority or similar schools.
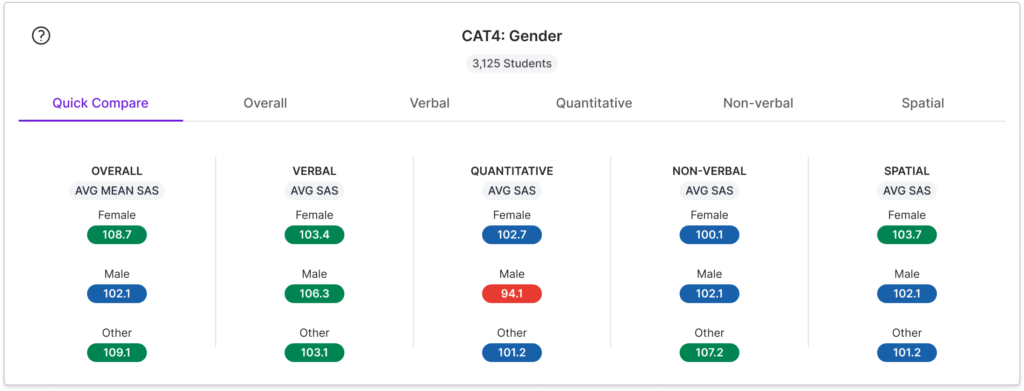
Comparative analysis
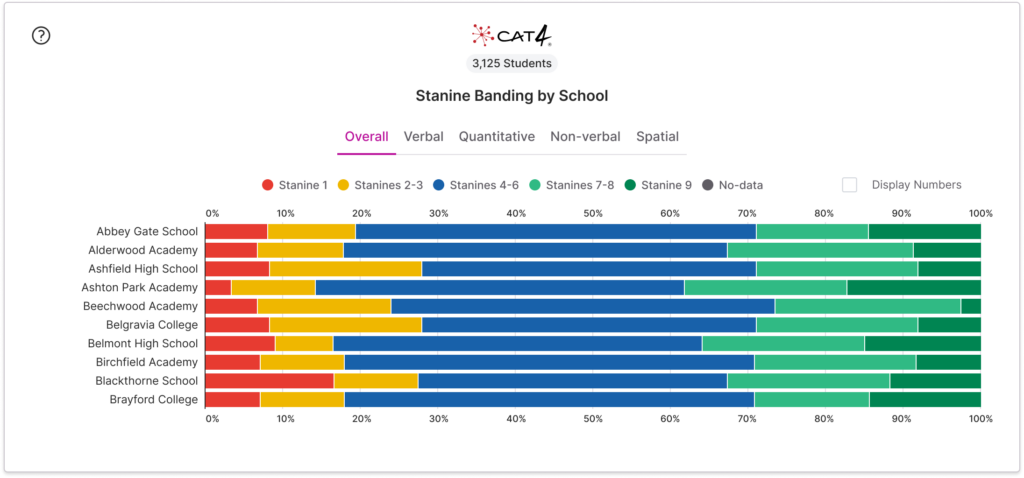
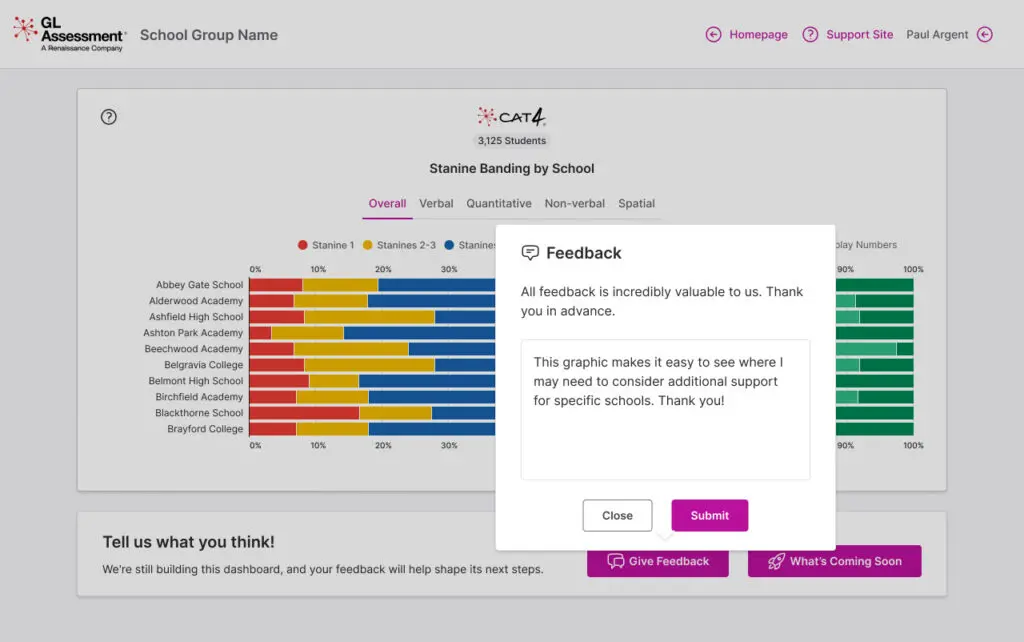
Compare scores and bandings across schools and assessments, helping to identify high-performing schools and those in need of some extra support or resources.
- School comparison, domain analysis and advanced filtering capabilities.
- Quickly identify beacon schools and where best practice may best be shared.
Enhanced user experience
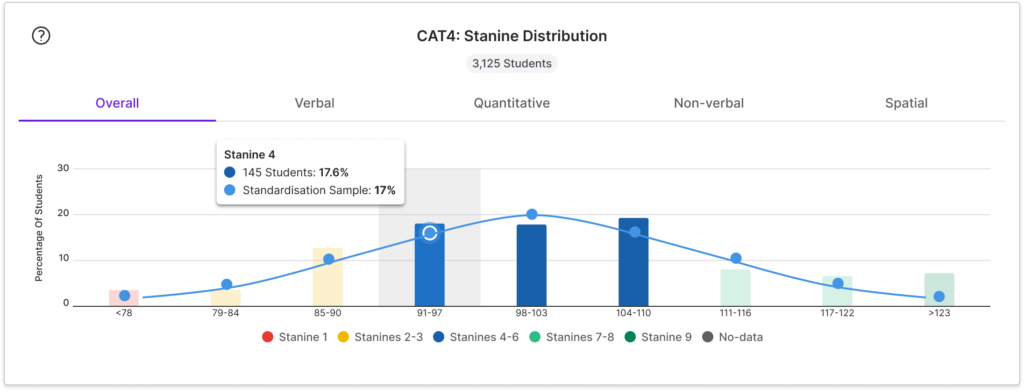
Make use of an intuitive, efficient and responsive dashboard experience, through which data is presented in clear, consistent formats, enabling dynamic data exploration through filters, segmentation tools and comparative views.
- Real-time reporting using live Testwise data, with no manual refreshes required.
- New accessible, tablet- and mobile-friendly reporting experience.
Save time
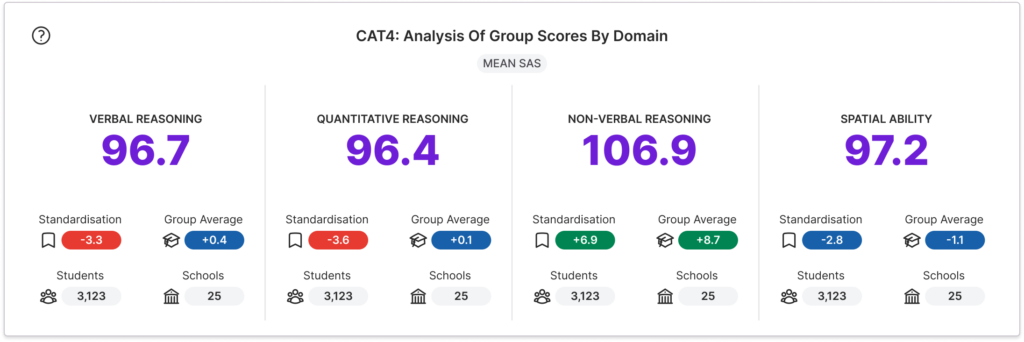
Reduce the time strategic leaders spend gathering and interpreting data by making use of centralised key metrics and automated comparisons.
- Access organisation-wide insights from a single dashboard; no need to review schools individually.
- Focus your efforts on evidence-informed decision-making and not on data collection and analysis.
Inform further development
Identify opportunities for further enhancement and submit feedback directly to our team – to inform future development and improve the overall experience.
- Provide feedback in-platform to directly influence the product development decisions made within these reporting dashboards.
- Request additional features or amended views and directly influence the practice of strategic leaders across the globe.
Our Support Promise
-
Training
From webinars to bespoke sessions, our comprehensive and flexible training programmes ensure you can maximise your GL Assessment tools.
-
Data Support
Turn insights into actionable outcomes. Unlock the full power of your assessment data with dedicated support from our Education Advisors.
-
Support
All of our assessments come with a suite of helpful guides designed to get you started and keep benefiting from the data. Technical information and platform support are here too.
-
Customer Service
Need to place an order? Or have a technical question? You’ll find our contact details here – people, not call centres, just a phone call away.
FAQs
Are the multi-school dashboards available to all Testwise users?
Any groups of schools with a Testwise cluster account will be able to access the dashboards by logging in to Testwise in the usual way.
How do I enter the ‘Insights’ dashboards?
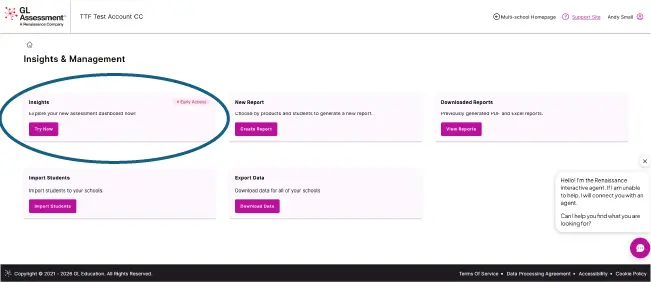
Upon logging in to Testwise, users with cluster account access will see a new ‘Insights’ tile option when they select the ‘Multi School’ option (as opposed to ‘Single School’), as per the image below. Clicking this tile will take you straight into the dashboards interface.
Are the dashboard views the same for everyone?
No. Considering the student metadata templates that underpin student-level data for different school types across the world, we have tried to ensure that filtering options are relevant to school groups of different types and in different countries.
For example, school groups in the UAE will find that an Emirati field is present within their dashboards. This will not be the case for school groups in the UK, for which Pupil Premium and Free School Meals fields will appear.
Why are only certain assessments included? Why is no data from other Renaissance products present?
Since the ‘Insights’ dashboards sit in Testwise and draw upon data available in that platform only, it is not possible to pull into them any data from Star assessments, for example.
How do I share my feedback and ideas for iteration?
Embedded within the dashboards are opportunities to provide feedback on every page and process. You can share your thoughts and experience with us – and this feedback goes directly to the team involved in the ongoing design and iteration of these dashboards.
Why is NGMT included if it is not an assessment that will continue to be available in the long term?
Whilst the New Group Maths Test (NGMT) will be retired during summer 2027, many schools and school groups continue to make use of the assessment and so we have retained it within the dashboards. The same analysis is available for NGMT as is available for NGRT, with sub-domain scores available for all five of the different aspects of the test:
- Number & algebra
- Fractions, decimals, percentages, proportion and ratio
- Measurement, geometry and statistics
- Maths fluency and procedures
- Reasoning and problem solving
Why is paper and digital assessment information shown on separate tiles and not combined?
While it can be appropriate to compare data across paper and digital administrations of the same assessment at an aggregate level, differences in test content or structure often limit comparability. In these cases, aggregating results across formats can create misleading interpretations of the data. Where wider comparisons are possible they have been included.
Do these dashboards replace cluster reporting?
We hope that the ‘Insights’ dashboards will become your preferred route to reporting. All other reporting flows will continue to remain available to you for now, however.
Find out more
Get in touch via the form below and our team will help explain how the Multi-School Dashboard can help you get a full picture of your students’ results.