“ ”


Data capture sheet summarising class scores in each assessment
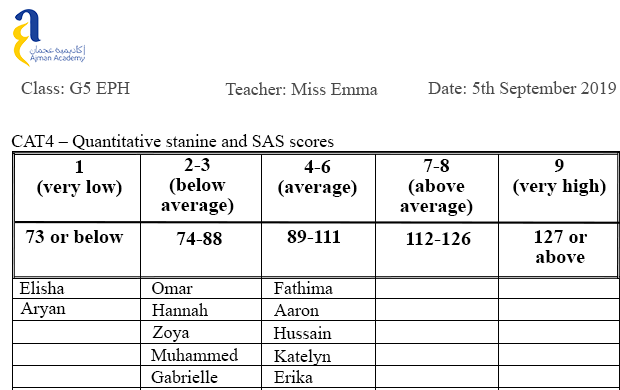
Data capture sheet allocating students to stanine groups (all students have been anonymised).
Sharing data with the teaching team
The school administers CAT4 at the start of each academic year and the PT Series at the end. Once all of the students have completed their CAT4 tests, the assessment team carries out initial analysis of the data, creating grade by grade ‘overview sheets’ in Excel with all the key information, colour coded for ease of use.
Emma explains more: “I create a summary spreadsheet that provides an overview of the data for each grade – and share that with the class teachers. We then ask them to create a ‘data capture sheet’ for the students in their class. This gets them thinking about each student’s data and what subsets or groups they might target for differentiated activities. It helps them to think about the information the data provides, and the implications for their teaching.”
The teachers divide the data in two ways – looking at a summary of the scores by student for both CAT4 and the PT Series, then splitting their class into the different CAT4 and PT Series stanine groups, so that they can easily see which students fall into each category. This supports the collaborative planning meetings that are held each week with the PYP Co-ordinator. Each meeting includes discussion of the data to inform differentiation.
Emma continues: “The groupings in the data sheets provide guidance on differentiation groups, supporting planning. We encourage the teachers to create a folder containing all of the student information, including the data sheets, and to bring these along to our planning meetings. This means that they will always have the data in mind when they are doing their planning and when we’re discussing the activities. We can look at, for example, how they’re going to ensure that their less able students, who might be struggling to access the curriculum, can have their learning scaffolded in order to achieve expectations. And likewise, how we can challenge and stretch the more able.”
The initial analysis involves the test scores, but once that has been looked at, the teachers are encouraged to look at the full suite of reports that come with each assessment from GL Education to make full use of the wider information they contain.
Emma explains: “We share all of the CAT4, PT Series and NGRT reports with the team via a Google folder. This means that they can refer to the overview spreadsheet for initial analysis via the data sheets, but if they then want to dig in more detail into the data for a particular student then they can look at the reports and see the further information that is included in the narratives, such as what interventions are recommended.”
The school runs internal teacher workshops on how to support students in light of the data – exploring what the results mean, discussing them at both individual student level and a whole-class overview. The teachers responded to this information, recognising traits in real students.
Emma explains: “We had one member of staff who had quite a gifted class, and I sat with her and the class data sheet and we worked on it together. I went through what jumped out at me from her sheet, and from there we highlighted a few students and I was able to say, ‘from the data I think student x would be like this.’ And she agreed – so could see that the information supports her teacher judgement and what we already know about the students.”
Using NGRT to inform literacy planning and interventions
The school had identified that there was a gap between attainment and potential, based on the CAT4 data – particularly in reading. They saw a verbal deficit (where there is a significant difference between a student’s CAT4 verbal and non-verbal scores) in quite a high proportion of students within the school.
Emma explains: “Many students in the school are Arabic speakers, so English is their second language. In some cases, they can read words perfectly well but their comprehension isn’t there. So as part of my analysis of the CAT4 data, I work out the verbal deficit for each child and highlight to the class teacher any who have a deficit of 12 or above, as these students may need further literacy support.
We knew that we wanted to baseline reading across all of Grades 3, 4 and 5 so chose NGRT to administer at the start of the last academic year so we had a starting point. We also knew that we could use the CAT4 and NGRT combination reports for further insights. We then chose Grade 4 for a reading intervention programme.
We put in place a new programme of literacy activities and interventions across the whole grade. We looked at exposing students to a more literacy-rich environment, in term 2 especially, to see what the impact would be. We identified groups of students and came up with different strategies for each – including guided reading with certain groups, weekly one-to-one reading sessions with the PYP Co-ordinator and modelling lessons.
Our school runs a system of units of enquiry, which are 6-week blocks – each of these in term 2 were research- and reading-heavy which involved a whole set of literacy skills as well as reading and comprehension. We then looked at different ways that the staff could help students with a verbal deficit – perhaps using more images, also not shying away from exposing the students to rich language. So if a child had, say a reading age of 6, and they were in Grade 5, in a lot of cases these were students who were quite capable when you looked at their non-verbal score, it was just their understanding that held them back.”
The school has already started to see results. “Some of the students were running up to the PYP Co-ordinator and saying “I can’t wait to read with you today”, so are really excited about reading,” Emma explains.
“ ”

“ ”

Adding PASS to your other assessment data to better understand barriers to learning
Ajman has also started using PASS in grades 4 and 5, to look at their students’ attitudes to learning and to help teachers get a better understanding of any barriers that may be having a negative impact on students’ attainment.
Emma explains more: “We’re not using PASS as a separate tool, but as additional information that lets us look at the child in a holistic way. PASS allows us to see what’s going on in terms of their self-esteem in their academic work, their perceived capability.
One of our students, for example, we think is ADHD. His behaviour isn’t great, and his PASS scores were low for self-belief, so he’s disengaged. The teacher was able to use things that he was interested in to engage him more. I have a background in psychology, and know that building relationships in the class is so important - building confidence and rapport.
PASS gives you the added dimension to look at the child and see mindsets that may be hidden and are affecting them reaching their potential.”
The impact and next steps
Although the 2019/20 academic year has been impacted by the Coronavirus pandemic, the school has already begun to see the impact of the measures that had been put in place.
Emma explains: “We’ve seen great benefits for the teachers – they have more ownership and understanding of the data, which in turn provides them with more understanding of the students that they’re teaching. It also helps them to reflect on their teaching practice, as each year’s students are different, so this allows them to dig into what’s right for this particular cohort.”
The teachers have also seen the positive impact the measures have had on the students, noting “we’ve been able to provide a much more personalised learning environment, which allows the students to flourish and grow.”
The team does fear that the interruption to learning caused by the recent lockdown may have led to a decline in literacy during this period – so are already setting in place plans for the new school year.
Emma explains: “At the start of the coming academic year we’re planning on using NGRT again to set a new baseline and identify any reading gaps that have crept in during the period of lockdown.
After testing our literacy interventions in Grade 4, we’re going to make literacy a whole-school focus for the new academic year with a structured and prescriptive plan to teach up and scaffold down, using the data from this year. We’re going to look at both reading and writing – teaching comprehension strategies, linking in to their unit of enquiry as much as possible and aiming to foster a love of reading across the school.”

