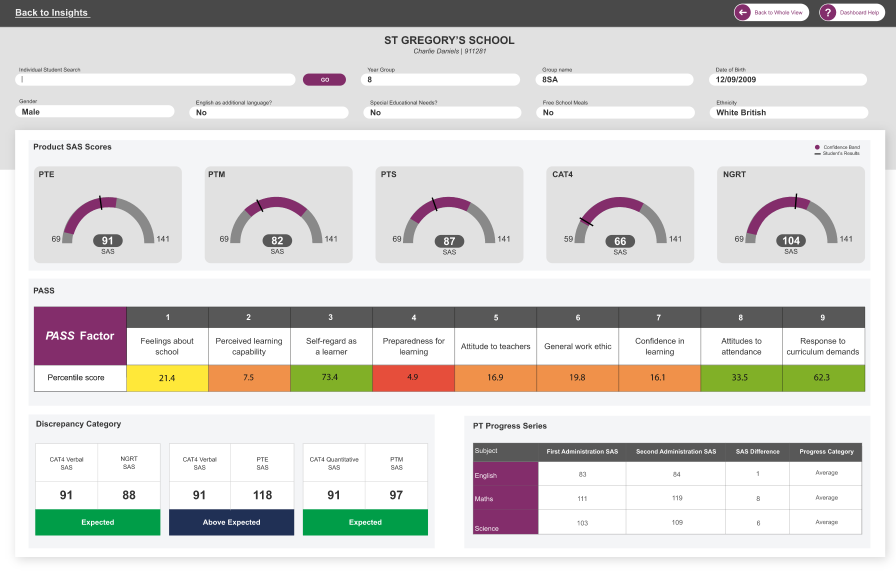
Skip to content

Need advice?

Leave your details below and one of the team will get in touch.

Please do not use this form to share anyone’s personal details.

The GL Data Dashboard

Join the dots to get a full picture of your students’ results

The GL Data Dashboard will help you join up all your assessment results, so that they’re simple to access and easier to understand. The new dashboard will make it easier for you to compare data from CAT4, the Progress Test Series, New Group Reading Test (NGRT) and PASS, enabling you to quickly identify trends or correlations, and understand what the results mean for a student, a cohort, and the whole school.

Book a Demo

Make an enquiry

How the GL Data Dashboard can help you

Holistic view

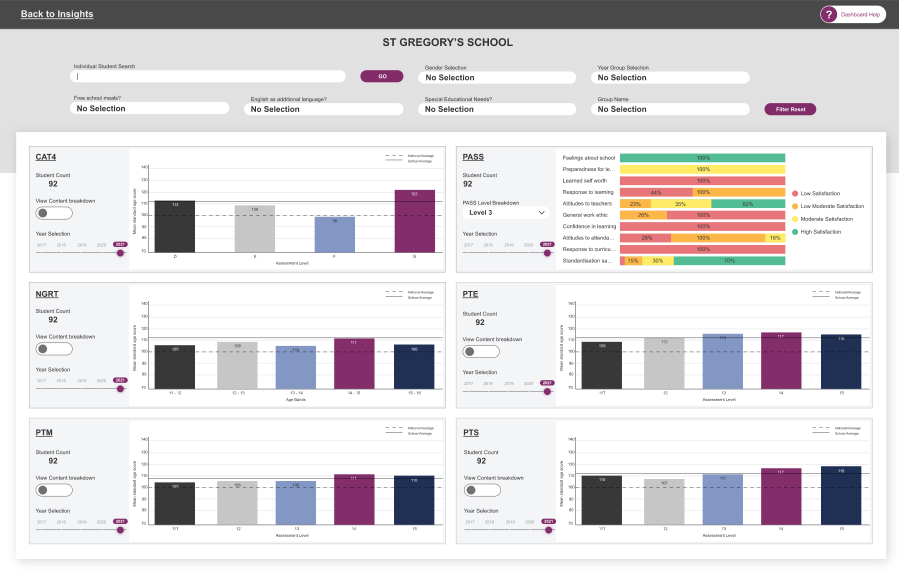
Analyse results data across the whole school to get a holistic view of performance, filter to view student sub-groups within your school and view individual student results from CAT4, the Progress Test Series, NGRT and PASS through the dynamic dashboard.
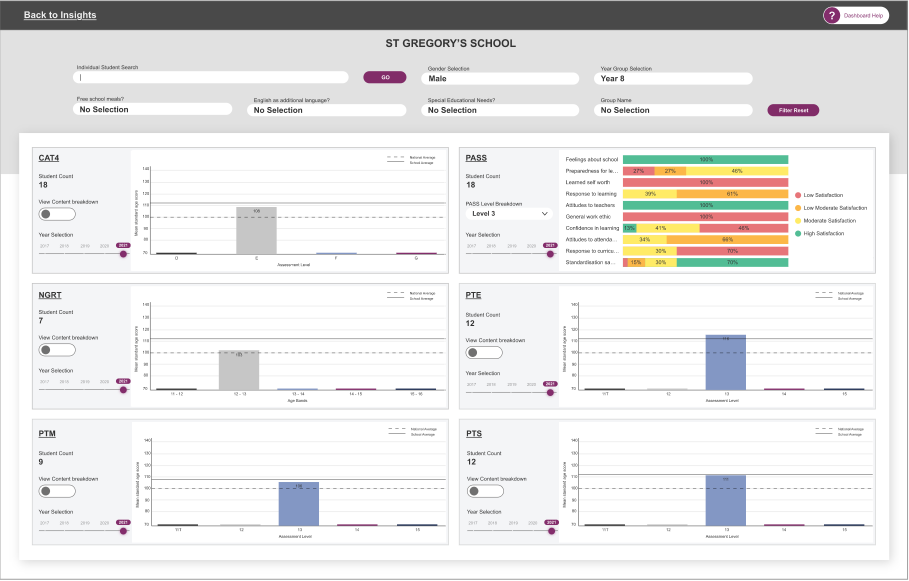
Find out more

Whole school view

Get a holistic view of performance across your school. The whole school view allows you to review assessment results from CAT4, NGRT, PT Series and PASS all together.

Identify trends

Identify trends or correlations that might otherwise have gone unnoticed, enabling you to identify students or groups of students that require intervention.

Find out more

Filter by subgroup

By filtering to view sub-groups of students you can hone in on particular areas of interest to better understand a group of students

Data in one place

By consolidating key results data into one place, the GL Data Dashboard makes it easier to draw valuable insights, enabling greater and faster impact on student outcomes.

Find out more

Individual student view

The individual student view allows you to view results across multiple assessments and quickly gain a full understanding of each student’s attainment, potential and wellbeing.

Save time

The GL Data Dashboard reduces time spent on admin with key results data from core assessments accessible in one place, increasing the time for analysis and ensuring that pupil interventions are as effective as possible.

Collaborate efficiently

Easily share data across all school stakeholders to build collaboration and engagement with results data through improved reporting and accessibility.

FAQs

What does the GL Data Dashboard show?

You can see the combination of scores from different assessments by individual student, cohort and whole school.

The dashboard will allow you to view all the data for that academic year. You can view previous years as well by changing the date field but you can only view one year at a time.

Which assessments is the dashboard compatible with, and is there a minimum number of assessments I need to use?

The dashboard is available for CAT4, Progress Test in English, Progress Test in Maths, Progress Test in Science, the New Group Reading Test and PASS. You will need to use at least two of these assessments to access the dashboard.

When will the GL Data Dashboard be available?

The GL Data Dashboard is now available in the reporting section of your Testwise account.

How do I access it?

The dashboard is accessible through Testwise.

Do I need to do anything to prepare?

We would recommend that before getting access to the dashboard you ensure that all of your student data is up to date and all the staff that you want to be able to access the dashboard are able to login to Testwise. For instructions on how to update your student data visit our Support website.

Is the service available for both paper and digital assessments?

No. The service will only be available for digital assessments.

I have a question who do I call?

If you have any questions about the new dashboard, please contact your account manager.

What data does it show?

The dashboard can be filtered into three views: whole school, group and individual pupil.
The school and group views will show:

  • Mean SAS by test level (CAT4 and PT Series)
  • Mean SAS by student age (NGRT)
  • National average
  • School average
  • Percentile scores by factor (PASS).
  • You will also be able to drill down to view SAS by battery, stanines and analysis by PASS level.

The individual pupil view will show:

  • Mean SAS
  • Battery SAS
  • Year on year progress (PT Series)
  • Reading age (NGRT)
  • Sentence completion stanine (NGRT)
  • Passage comprehension stanine (NGRT)
  • Discrepancy categories – CAT4 quantitative with Progress Test Maths SAS, CAT4 verbal with Progress Test English SAS and CAT4 verbal with NGRT SAS
  • Percentile scores by PASS factor.

Is there an additional cost?

No. There is no additional cost.

Book a Demo

Make an enquiry